The following information is obtained from the November 2016 CCJ MarketPulse Report, a survey of more than 200 senior executives at trucking companies who have agreed to participate monthly. The November 2016 CCJ MarketPulse Report received 77 completed responses from carrier executives. If you would like to participate in the CCJ MarketPulse survey, email CCJ Editor Jeff Crissey.
Fleets optimistic about 2017

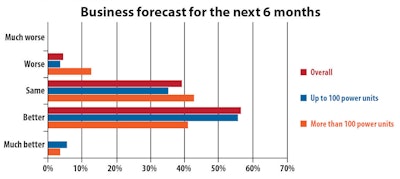
MarketPulse survey respondents are increasingly bullish about business conditions over the next six months, with 56.5 percent of respondents expecting business conditions to improve (41.3 percent last month). Respondents from fleets with up to 100 power are more optimistic, with 61.2 percent saying business will be better compared to 44.6 percent of respondents from fleets with more than 100 power units. On a month-over-month basis, survey respondents indicated improving business conditions in November compared to October, with 26.0 percent of all respondents saying November was better than October and 18.2 percent saying it was worse. Compared to the same month last year, however, 48.0 percent of all respondents said November 2016 was worse, while 24.7 percent said it was better.
No hurry to buy

Despite the growing optimism for 2017, only 33.8 percent of all respondents have plans to add capacity in the next six months, while 63.7 percent plan to keep fleet size the same by either replacing aging equipment or not making any changes.
Driver shortage remains top of mind

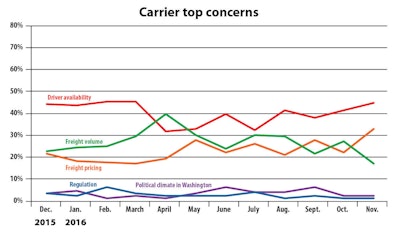
Once again, driver availability ranks as the biggest worry for survey respondents, with 44.8 percent listing it as their top concern. Freight pricing (32.9 percent) and freight volume (17.1 percent) trade spaces as the No. 2 and No. 3 concerns, respectively. The political climate in Washington was a top concern for only 2.6 percent of respondents, still good enough to rank No. 4 on the list.
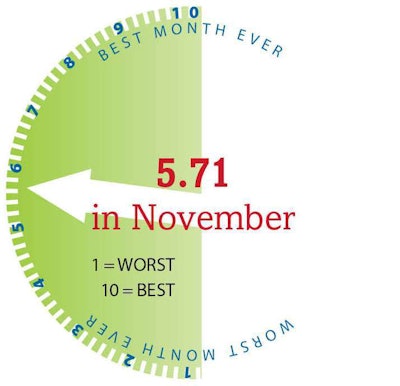
Carrier sentiment edges up


